텍스트 유사도
| 코사인 유사도 (Cosine Similarity) | -> 두 개의 벡터 값의 Cos 각도 |
| 유클리디언 유사도 (Euclidean Similarity) | -> 두 개의 점 사이의 거리 = L2 거리 |
| 맨하탄 유사도 (Menhattan Similarity) | -> 사각 격자 최단 거리 = L1 거리 |
| 자카드 유사도 (Jaccard Similarity) | -> 교집합과 합집합의 크기로 계산 |
두 문장이 주어졌을 때, 두 문장이 서로 얼마나 유사한지 나타내주는 기법
아래에서 입력값으로 받는 Sentences는 ["Hello World", "Hello Word"] 형식이다.
### 코사인 유사도 ###
def cos_performance(sentences) :

    tfidf_vectorizer = TfidfVectorizer()
     # 문장 벡터화(사전 만들기)

    tfidf_matrix = tfidf_vectorizer.fit_transform(sentences)

    cos_similar = cosine_similarity(tfidf_matrix[0:1], tfidf_matrix[1:2])
return cos_similar[0][0]### 유클리디언 유사도 (두 점 사이의 거리 구하기) ###
def euclidean_performance(sentences) :
tfidf_vectorizer = TfidfVectorizer()
tfidf_matrix = tfidf_vectorizer.fit_transform(sentences)
## 정규화 ##
tfidf_normalized = tfidf_matrix/np.sum(tfidf_matrix)
euc_d_norm = euclidean_distances(tfidf_normalized[0:1],tfidf_normalized[1:2])
return euc_d_norm[0][0]### 맨하탄 유사도(격자로 된 거리에서의 최단거리) ###
def manhattan_performance(sentences) :
tfidf_vectorizer = TfidfVectorizer()
tfidf_matrix = tfidf_vectorizer.fit_transform(sentences)
## 정규화 ##
tfidf_normalized = tfidf_matrix/np.sum(tfidf_matrix)
manhattan_d = manhattan_distances(tfidf_normalized[0:1],tfidf_normalized[1:2])
return manhattan_d[0][0]
Sentence Transformer 사용
| Sentence Transformer | sentence-transformers/all-MiniLM-L6-v2 |
| Sentence Transformer | sentence-transformers/bert-base-nli-mean-tokens |
HuggingFace에 올라와있는 문장 유사도 측정을 위한 Sentence Transformer 이다.
def sentence_transformer(sentences) :
    seed.set_seed(42)
    model_name = "'sentence-transformers/bert-base-nli-mean-tokens" #or sentence-transformers/all-MiniLM-L6-v2
    device = torch.device("cuda:0") if torch.cuda.is_available() else torch.device("cpu")

    def mean_pooling(model_output, attention_mask):
        token_embeddings = model_output[0]
        input_mask_expanded = attention_mask.unsqueeze(-1).expand(token_embeddings.size()).float()
        return torch.sum(token_embeddings * input_mask_expanded, 1) / torch.clamp(input_mask_expanded.sum(1), min=1e-9)


    tokenizer = AutoTokenizer.from_pretrained(model_name, local_files_only=True)
    model = AutoModel.from_pretrained(model_name, local_files_only=True)
    model.to(device)

    encoded_input = tokenizer(sentences, padding=True, truncation=True, return_tensors='pt')
    encoded_input.to(device)

    with torch.no_grad():
        model_output = model(**encoded_input)

    sentence_embeddings = mean_pooling(model_output, encoded_input['attention_mask'])

    sentence_embeddings = F.normalize(sentence_embeddings, p=2, dim=1)
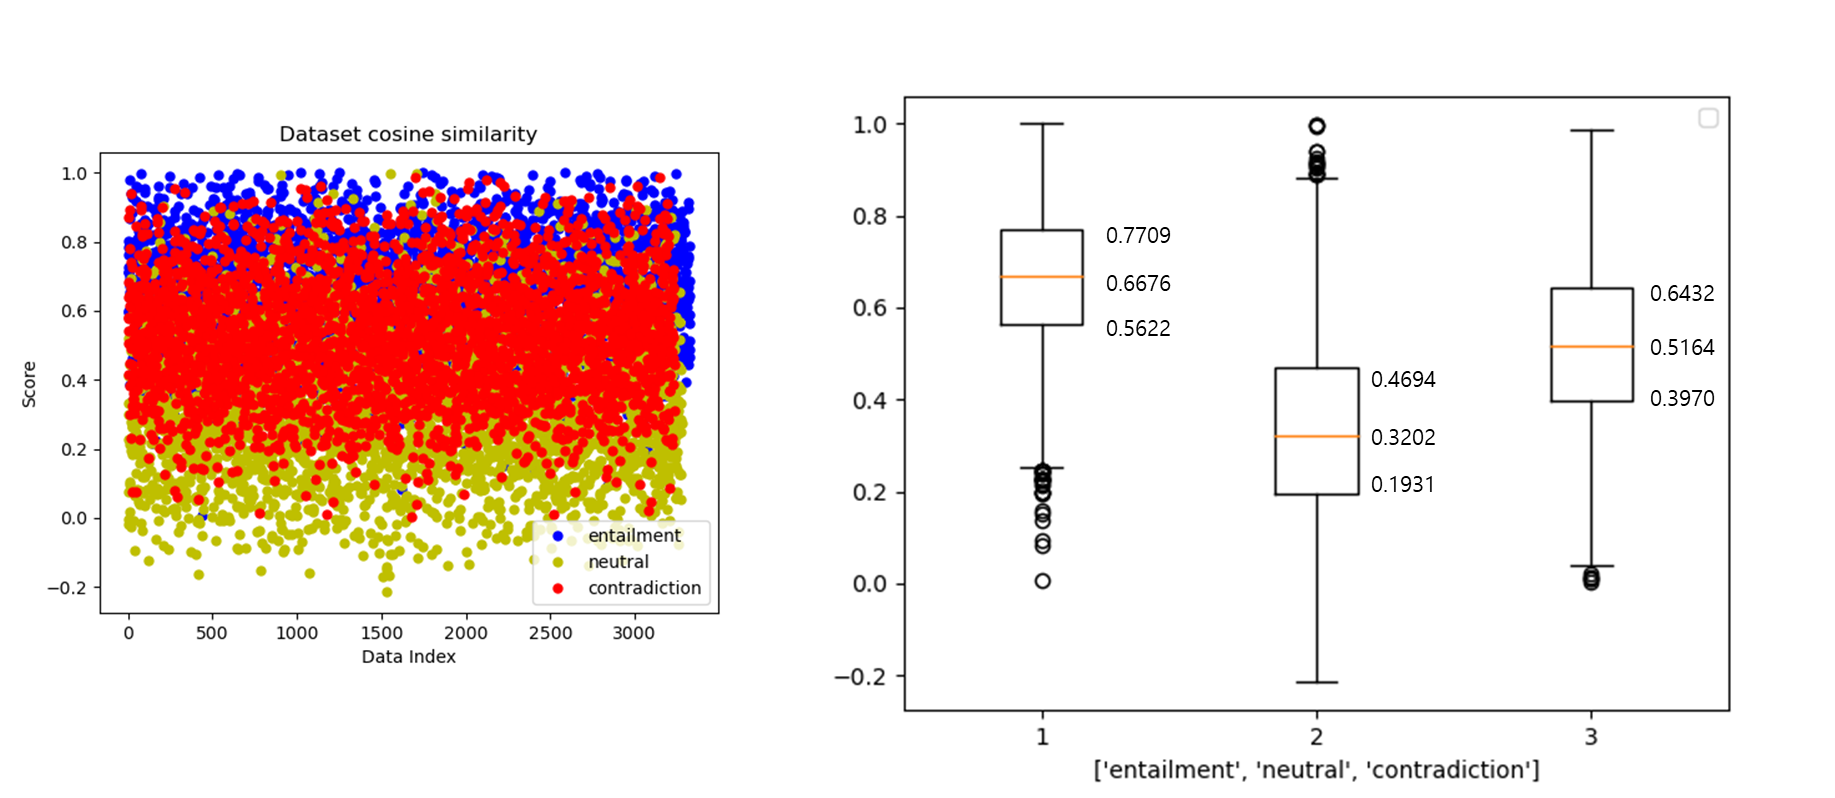
return sentence_embeddings이렇게 문장들의 문장 유사도를 구할 수 있다.
NLI 데이터셋을 넣어서 점수를 구하고, 이를 시각화 하면 아래와 같이 출력할 수 있다.
(연관, 모호, 모순 데이터셋)
WordNet 의미 유사도 측정
| 경로 거리 기반 유사도 |
|
| Leacock Chordorow 유사도 |
|
| Wu-Palmer 유사도 |
|
import wordnet

#경로 거리 기반 유사도
right_whale = wordnet.synset('right_whale.n.01')
orca = wordnet.synset('orca.n.01')
right_whale.path_similarity(orca)

#Leacock Chordorow 유사도
right_whale = wordnet.synset('right_whale.n.01')
orca = wordnet.synset('orca.n.01')
right_whale.lch_similarity(orca)

#Wu-Palmer 유사도
right_whale = wordnet.synset('right_whale.n.01')
orca = wordnet.synset('orca.n.01')
right_whale.wup_similarity(orca)
from sklearn.feature_extraction.text import TfidfVectorizer
from sklearn.metrics.pairwise import cosine_similarity
import pandas as pd
import matplotlib.pyplot as plt

df = pd.read_csv('train.csv')

# TF-IDF 벡터화
tfidf_vectorizer = TfidfVectorizer()
tfidf_matrix = tfidf_vectorizer.fit_transform(df['sentence'])

# 코사인 유사도 계산
cosine_similarities = cosine_similarity(tfidf_matrix, tfidf_matrix)
print(cosine_similarities)

# 히트맵으로 코사인 유사도 시각화
plt.imshow(cosine_similarities, interpolation='nearest')
plt.colorbar()
plt.show()728x90
반응형
텍스트 유사도
| 코사인 유사도 (Cosine Similarity) | -> 두 개의 벡터 값의 Cos 각도 |
| 유클리디언 유사도 (Euclidean Similarity) | -> 두 개의 점 사이의 거리 = L2 거리 |
| 맨하탄 유사도 (Menhattan Similarity) | -> 사각 격자 최단 거리 = L1 거리 |
| 자카드 유사도 (Jaccard Similarity) | -> 교집합과 합집합의 크기로 계산 |
두 문장이 주어졌을 때, 두 문장이 서로 얼마나 유사한지 나타내주는 기법
아래에서 입력값으로 받는 Sentences는 ["Hello World", "Hello Word"] 형식이다.
### 코사인 유사도 ###
def cos_performance(sentences) :

    tfidf_vectorizer = TfidfVectorizer()
     # 문장 벡터화(사전 만들기)

    tfidf_matrix = tfidf_vectorizer.fit_transform(sentences)

    cos_similar = cosine_similarity(tfidf_matrix[0:1], tfidf_matrix[1:2])
    return cos_similar[0][0]
### 유클리디언 유사도 (두 점 사이의 거리 구하기) ###
def euclidean_performance(sentences) :
tfidf_vectorizer = TfidfVectorizer()
tfidf_matrix = tfidf_vectorizer.fit_transform(sentences)
## 정규화 ##
tfidf_normalized = tfidf_matrix/np.sum(tfidf_matrix)
euc_d_norm = euclidean_distances(tfidf_normalized[0:1],tfidf_normalized[1:2])
return euc_d_norm[0][0]### 맨하탄 유사도(격자로 된 거리에서의 최단거리) ###
def manhattan_performance(sentences) :
tfidf_vectorizer = TfidfVectorizer()
tfidf_matrix = tfidf_vectorizer.fit_transform(sentences)
## 정규화 ##
tfidf_normalized = tfidf_matrix/np.sum(tfidf_matrix)
manhattan_d = manhattan_distances(tfidf_normalized[0:1],tfidf_normalized[1:2])
return manhattan_d[0][0]
Sentence Transformer 사용
| Sentence Transformer | sentence-transformers/all-MiniLM-L6-v2 |
| Sentence Transformer | sentence-transformers/bert-base-nli-mean-tokens |
HuggingFace에 올라와있는 문장 유사도 측정을 위한 Sentence Transformer 이다.
def sentence_transformer(sentences) :
    seed.set_seed(42)
    model_name = "'sentence-transformers/bert-base-nli-mean-tokens" #or sentence-transformers/all-MiniLM-L6-v2
    device = torch.device("cuda:0") if torch.cuda.is_available() else torch.device("cpu")

    def mean_pooling(model_output, attention_mask):
        token_embeddings = model_output[0]
        input_mask_expanded = attention_mask.unsqueeze(-1).expand(token_embeddings.size()).float()
        return torch.sum(token_embeddings * input_mask_expanded, 1) / torch.clamp(input_mask_expanded.sum(1), min=1e-9)


    tokenizer = AutoTokenizer.from_pretrained(model_name, local_files_only=True)
    model = AutoModel.from_pretrained(model_name, local_files_only=True)
    model.to(device)

    encoded_input = tokenizer(sentences, padding=True, truncation=True, return_tensors='pt')
    encoded_input.to(device)

    with torch.no_grad():
        model_output = model(**encoded_input)

    sentence_embeddings = mean_pooling(model_output, encoded_input['attention_mask'])

    sentence_embeddings = F.normalize(sentence_embeddings, p=2, dim=1)

    return sentence_embeddings
이렇게 문장들의 문장 유사도를 구할 수 있다.
NLI 데이터셋을 넣어서 점수를 구하고, 이를 시각화 하면 아래와 같이 출력할 수 있다.
(연관, 모호, 모순 데이터셋)
WordNet 의미 유사도 측정
| 경로 거리 기반 유사도 |
|
| Leacock Chordorow 유사도 |
|
| Wu-Palmer 유사도 |
|
import wordnet

#경로 거리 기반 유사도
right_whale = wordnet.synset('right_whale.n.01')
orca = wordnet.synset('orca.n.01')
right_whale.path_similarity(orca)

#Leacock Chordorow 유사도
right_whale = wordnet.synset('right_whale.n.01')
orca = wordnet.synset('orca.n.01')
right_whale.lch_similarity(orca)

#Wu-Palmer 유사도
right_whale = wordnet.synset('right_whale.n.01')
orca = wordnet.synset('orca.n.01')
right_whale.wup_similarity(orca)
from sklearn.feature_extraction.text import TfidfVectorizer
from sklearn.metrics.pairwise import cosine_similarity
import pandas as pd
import matplotlib.pyplot as plt

df = pd.read_csv('train.csv')

# TF-IDF 벡터화
tfidf_vectorizer = TfidfVectorizer()
tfidf_matrix = tfidf_vectorizer.fit_transform(df['sentence'])

# 코사인 유사도 계산
cosine_similarities = cosine_similarity(tfidf_matrix, tfidf_matrix)
print(cosine_similarities)

# 히트맵으로 코사인 유사도 시각화
plt.imshow(cosine_similarities, interpolation='nearest')
plt.colorbar()
plt.show()
728x90
반응형